Getting ready for machine learning - cleaning up free NHL game and odds datasets
Before beginning any feature engineering or ML, it’s necessary to clean up the data first. In this article we work through a real-life example
It always seems like the majority of investors who pick individual stocks will underperform couch potato investors who simply invest in a diversified ETF. At first glance, this was unintuitive to me. Surely just throwing darts on a board would lead to a 50% win/loss rate when comparing performance of the chosen stock to the market, it’s just basic statistics. However, a closer analysis to historical asset performance demonstrates why this is.
Just like “whales” in free-to-play microtransaction-filled mobile games, a majority of the earnings come from a small subset of stocks. As per PensionCraft and ValueWalk, 64% of stocks underperformed the market. While 36% outperformed the market, only 6.1% significantly outperformed (500%+ increase) the market. Looking at the total return on ETFs, 75% of stocks had a return of 0, whereas the remaining 25% made up the entire return.
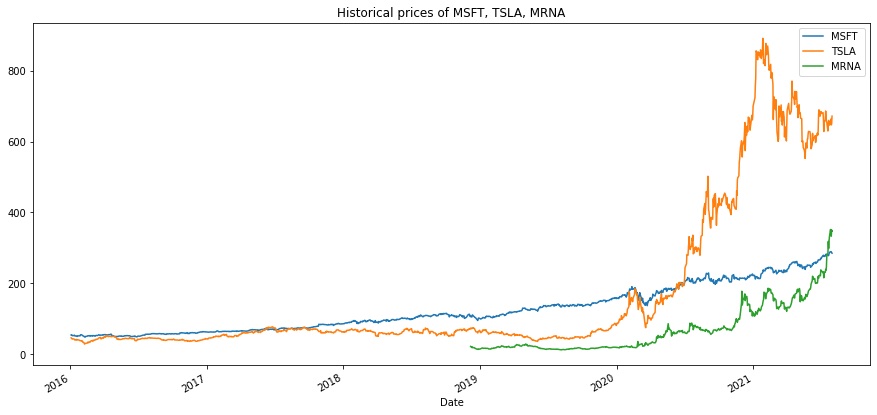
What this tells us is that statistically choosing individual stocks is more likely to underperform the market. For every TSLA, MSFT, MRNA etc that have made the overall return of ETFs that hold them look positive, there are dozens of stocks that are stagnating or otherwise underperforming the overall market. If you’re going to insist on picking individual stocks, you must have strong convictions that this asset is, for whatever reason, one of the lucky 36%. Even then, your criteria may need to be more strict than just “barely outperform the market” when you factor in the required time investment to analyze stocks.

Of course, it’s no fun to just say “well, statistically we’re likely to lose, no point in trying.” If it is possible to find the “whale” stocks with some degree of accuracy, the returns prove worth it. In a future post, I’ll investigate creating a classifier that looks to identify which stocks that have not yet broken out will be the new 500%+ winners.
Before beginning any feature engineering or ML, it’s necessary to clean up the data first. In this article we work through a real-life example
Discovering several profitable trends that consistently produce positive returns yearly
Leveraging historical performance and spread data to predict what team will cover the spread
昨日はカナダの選挙でした。人気ではありませんでした。
Comparing at the over/under line from 2010 with weather, team ratings, weeks, etc
A review of Matt Rudnitsky’s ‘Smart Sports Betting: How to Shift from Diehard Fan to Winning Gambler’
64% percent of stocks underperform the market and only 6.1% will outperform by 500%+. What makes these outperformers unique?
Using standard QB stats from 2016-2019, teammate ratings, and strength of schedule to predict 2020 fantasy points.
Using standard QB stats from 2016-2019 to compare predicted 2020 fantasy points vs actual performance.
雪が降っていて、桜はアイスクリームみたい
来週、ユダヤの祝日のハヌカーです。
毎年、北米で人気のゲームFantasy Footballをプレイしています。
Available on iOS, Android, BlackBerry, and Web, Red Sea Rescue is a passover themed game using tilt controls to avoid obstacles.
EZ4X is a graphical, automated forex paper trader that allows users to choose techincal indicators and risk tolerance to automatically execute trades on a cu...